Worldwide promotion of electric vehicles has brushed aside the opportunity to understand the nitty-gritty of charging. One of the most grasped yet often misunderstood concepts in this field is the LC. Chalking charging curve knowledge is central to the very efficiency of EV owners, to whom it also helps with trip planning and making choices on charging infrastructure.
We will cover the technicalities of the EV charging curve here: what it is, working of the curve works, why the curve matters, and comparisons of the charging curve with different vehicles and technologies. By the end of this, customers will have the science behind the charging process, will be able to read an EV charging curve chart, and will be able to make meaningful comparisons between vehicles.

What Is an EV Charging Curve?
A curve describing an EV charging process depicts how the charging speed of an Electric Vehicle changes while its battery charges from being empty to full. It is unlike that of filling a small fuel tank of a conventional car, in which the flow rate is rather constant.
What happens in most cases is that an EV charges fast at the beginning when the battery is very low and gradually slows down as the battery nears full capacity because batteries are sensitive to voltage, heat, and chemical stability, whereas charging systems are set up to protect battery health.
The typical EV charging curve chart uses the left vertical axis to plot charging power (kW) versus state of charge (SOC) on the horizontal axis. So, these visuals represent how fast electricity flows into the car at a specified battery level.
Why Is the EV Charging Curve Important?
Real moments with EV drivers are dictated by the charging curve. Two vehicles could be so labeled as to support “fast charging up to 150 kW,” whereas on paper, they both support the same peak rating, yet one holds on longer to that charge rate while the other swiftly tapers away. This perfectly makes one more suitable for being used on a trip than the other.
For planners for infrastructure and business, it is the charging curve that determines the use of chargers; the duration for which vehicles occupy the stations, the site where to place more chargers, and ultimately the return on investment of charging networks.
Of course, to manufacturers, the curve is a balance between battery protection and customer experience. Charge too fast, too long, the battery degrades, charge too slow, maybe no one buys.
Knowing the curve will give the EV owner insight into:
- Become an efficient trip planner.
- Avoid wasting time while charging that last 10-20%.
- Make realizable comparisons between EV models.
- Change charging behavior to improve the longevity of batteries.
The Science Behind EV Charging Curves
The charging of any battery is done by moving ions between electrodes in a controlled manner. Usually, the two essential phases are highlighted:
Constant Current (CC) Phase
- During this phase, the charger supplies as much current as the battery can safely accept.
- Hence, charging is fastest during this phase and can reach the peak charging power of the EV.
- This corresponds mostly to 0-60% or 0-70%, depending on the cinema, of rated battery capacity.
Constant Voltage (CV) Phase
- As the battery fills, the current gets reduced to prevent overcharging and overheating.
- Charging slows markedly now.
- The remaining 30-40% is covered here until the battery reaches 100%.
This is why charging from 10%-80% is much quicker than from 80%-100%.
Reading an EV Charging Curve Chart
For illustration, here’s a breakdown of a simplified EV charging curve chart:
- At 10% SOC, the EV begins charging rapidly, quickly ramping up to its maximum power.
- From 20–50% SOC, it holds near its peak speed, delivering fast charging times.
- Around 60–70% SOC, power begins to taper gradually.
- Beyond 80%, charging slows significantly, with the final 10–20% taking disproportionately long.
For these reasons, most manufacturers and EV experts recommend charging only to 80% for daily use or long trips unless you specifically need the extra range.
Comparing EV Charging Curves: Why Some Cars Charge Faster
EV charging curves differ from one EV to another. Charging power management methods can differ greatly, giving real-world charging performance a consideration.
Among those influencing the charging curve:
- Battery Chemistry
- There are several types of lithium-ion chemistries, such as NMC (Nickel Manganese Cobalt) and LFP (Lithium Iron Phosphate).
- The NMC cell generally allows for higher charge speeds, whereas LFP cells are made for high longevity and safety.
- Battery Size
- Larger batteries tend to have higher charging power for longer durations, as they otherwise dissipate heat and current well.
- Thermal Management
- Thermally better-managed systems will allow the car to maintain peak charging speeds for longer.
- Such ones with poor thermal management will start tapering prematurely, even at low SOC.
- Software and Safety Limits
- The level of limits is set by manufacturers with respect to battery health. Some allow very aggressive fast charging, whereas some do not for the sake of longevity.
- Charger Capability
The charging curve is also determined by whether you are using a 50-kW charger, a 150-kW charger, or a 350-kW ultra-fast charger.
When doing any EV charging curve comparison, look instead at sustained charging rates, rather than just peak power numbers.

Examples of EV Charging Curves
To understand differences better, let us consider some general examples in popular EV categories (note: the exact values vary by brand and model):
- Tesla Model Y (Long Range)
- Peak charging power: 250 kW
- Charging power stays high, above 200 kW, until around 50% SOC
- Charges are gradually slower over 60%
- Hyundai Ioniq 5
- Peak charging power: 230 kW (800V architecture).
- Charged 10–80% in 18 minutes under perfect conditions.
- Maintains a flatter charging curve, delivering consistency.
- Nissan Leaf (Older Models)
- Peak charging power: ~50 kW.
- Tapers much earlier, usually at around 40-50%.
- No active cooling to maintain performance.
- Those charging curves can prove more informative than manufacturer claims about “peak kW”.
Practical Relevance of the Charging Curve
For the average person driving, knowledge of the curve can help formulate charging strategies:
- Trip Planning: One should know if the curve decelerates beyond 80%, two short stops might be faster than one long stop to 100%.
- Battery Longevity: This reduces the stress put on the battery, thus elongating life on unnecessary top-ups to 100%.
- Charger Selection: During road trips, ultra-fast chargers work best within the first 50–60% SOC window. After that, their benefit tapers off.
Fleet operators and other businesses can use the same information to optimize charging schedules, lower downtime, and manage energy costs.
EV Charging Curve Comparison: Trends for 2025
By 2025, EV charging technology will have developed further, and new EV models will be setting new marks in efficiency. Here are some trends being considered to set the charging curves of tomorrow:
- 800V Architectures
This group consists of the Hyundai Ioniq 5, Kia EV6, and Porsche Taycan, which employ 800V systems that allow flatter and more uniform charging curves.
- Solid-State Battery Research
Though still far from mass production, solid-state batteries promise fast charging with less tapering at high SOC.
- Smart Charging Software
Car makers are now putting in place charging algorithms that use adaptive approaches to charging based on user patterns, climate, and charger types.
- Growing Charger Infrastructure
Eventually, with the increased availability of 350 kW chargers, more EVs can put the ultra-fast charging speeds toward further flattening of curves.
- Better Thermal Management
There is now a way to keep the charging speeds consistently high by liquid cooling of battery packs alongside pre-conditioning features of a car.
When simulating EV charging curve comparison in 2025, buyers will be able to ascertain a much less drastic tapering than with early generations of EVs.
EV Charging Curve Chart: Interpreting Real Data
Many manufacturers and independent testers publish EV charging curve charts. When reading one, be aware of:
- Peak Power: Maximum power level at a charge when it hits its best moment.
- Sustained Power: More crucial than peak, the amount of time charging is sustained at near-peak levels.
- Drop-Off Point: Percentage of SOC where charging speed starts to plummet.
- Time to 80%: This is also being taken as a practical standard during road trips.
For instance, an EV that meets its peak at 150 kW but tapers sharply onward the 40% road trip may not be so favorable as an EV at a peak of 120 kW but sustaining a 100+ kW charge till 70%.
EV Charging Curve vs. Real-World Factors
The charts offer merely theoretical insights. Real-world charging may be altered by various conditions.
- Temperature: Cold weather does not allow efficient charging unless the battery is in a state of preheat.
- Charger quality: Not all public chargers provide their rated power constantly.
- Battery condition: Some older batteries with a little degradation may differ from the exact factory curve.
- SOH: How much the battery is worn affects how it takes on high-power charging.
Charging curves should rather be used by drivers as a general guide than a set rule.
Best Practices for EV Owners
To make your EV charging the best it can be in the year 2025:
- Charge 10–80%
This is fast, convenient, and good for maintaining your battery health.
- Preconditioning
Most EVs will preheat or precool batteries before fast charging and maintain the curve optimally.
- Long Trip Planning
More stops for short charging sessions rather than one or two for the last slow percentiles.
- Know Your Curve
Study your particular EV and how it behaves, either from your manual or third-party tests.
- Keep Track of Charging Data
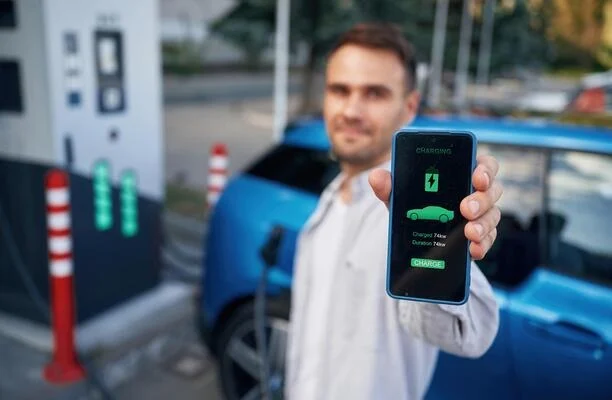
Apps and in-car displays often show you charge rates in real time, assisting with deciding when to disengage.

Future Outlook: How Will EV Charging Curves Change?
Once battery technologies evolve, charging curves shall change in form. Foresee now:
- Initial Ramp-Up Faster: Speeding up acceleration toward peak charging rates.
- Flatter Sustained Curves: Sustaining higher speeds longer for more vehicles.
- Shorter Taper Windows: Less time spent slowing down between high SOC values.
- Integrated with Smart Grids: Charging curve adaptations may be simultaneous with grid demand and renewable energy availability.
The late 2020s industry goal is to retrofit EV charging to be as fast, predictable, and stress-free as gasoline refueling.
Conclusion
The EV charging curve is one of the most critical yet overlooked aspects of electric vehicle ownership. It relates to how fast one can get the car back on the road, battery health over the long term, and also stands as a much better comparison between one EV and another than mere peak charging numbers.
Making intelligent decisions in 2025 through studying the charts of EV charging curves and meaningful EV charging curve comparisons will become paramount for both buyers and drivers. Faster, flatter, and more consistent charging is essentially how technology will improve, paving the way for EVs to become the norm.
For now, the takeaway is simple: know your vehicle’s charging curve, work around it, and your EV will provide maximum performance and longevity.


